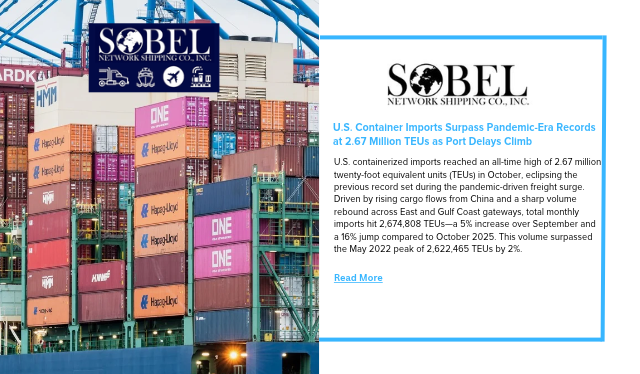
U.S. containerized imports reached an all-time high of 2.67 million twenty-foot equivalent units (TEUs) in October, eclipsing the previous record set during the pandemic-driven freight surge. Driven by rising cargo flows from China and a sharp volume rebound across East and Gulf Coast gateways, total monthly imports hit 2,674,808 TEUs—a 5% increase over September and a 16% jump compared to October 2025. This volume surpassed the May 2022 peak of 2,622,465 TEUs by 2%.
Following eight months of lagging behind the prior year’s pace, October marked the second consecutive month of cumulative growth, lifting year-to-date imports for the first 10 months of 2026 to 2.3% above the same period in 2025.
China and Major Trading Partners Drive Volume Imports originating from China expanded for the fourth straight month, climbing 6.9% from September and 22.9% year-over-year to reach 987,805 TEUs—the highest monthly total since January 2025. Chinese cargo accounted for roughly half of the total U.S. monthly gain, pushing China’s share of overall U.S. container imports up to 36.9% from 36.3% in September. Volume was led primarily by plastics, furniture and bedding, and toys, games, and sporting goods.
Broader global sourcing also contributed to the surge, with aggregate imports from the top 10 countries of origin rising 5.8% month-over-month. While shipments from Vietnam, Taiwan, and India saw slight monthly pullbacks, seven of the top 10 origins posted gains—highlighted by 22.8% monthly jumps from both South Korea and Germany. Notably, all 10 leading trade partners recorded higher volumes than in October 2025.
East and Gulf Coast Gateways Capture Market Share Cargo routing shifted noticeably toward East and Gulf Coast ports in October:
-
Houston led all top 10 U.S. gateways in volume growth, adding 42,665 TEUs (+26.7%).
-
Charleston (+18.6%), Norfolk (+17.7%), and Savannah (+12.6%) all posted double-digit monthly gains.
-
West Coast gateways saw modest contractions, with volumes dipping at Los Angeles (-1.4%), Long Beach (-2.0%), and Oakland (-10.9%).
As a result, the five leading East and Gulf Coast ports handled 39.9% of all U.S. container imports, up from 36.7% in September, while the top five West Coast ports saw their combined share slip from 47% to 44.9%. Across the Gulf Coast specifically, imports surged 24% to 266,905 TEUs—a regional record since tracking began in August 2023—with Houston driving approximately 83% of that net gain.
While extended peak-season demand and uneven vessel arrival schedules played a role, industry data indicates that the sharp East and Gulf Coast rebound partly reflects a recovery from softer September volumes. Combined imports across Houston, Savannah, Norfolk, and Charleston rose 18.1% month-over-month, though they sit just 3.6% above August levels.
Transit Delays Mount Under Sustained Pressure October’s record throughput follows four straight months of U.S. import volumes exceeding 2.5 million TEUs. That sustained cargo intensity is beginning to strain inland logistics networks. The unweighted average transit delay—measured from the estimated arrival date on the initial bill of lading to the date U.S. Customs and Border Protection-processed data is received—climbed to 6.3 days across 10 major gateways in October, up from 6.0 days in September and 4.2 days in June. Seven of the 10 tracked ports experienced longer dwell and transit delays during the month.
Geopolitical, Routing, and Labor Risks on the Horizon Importers and supply chain planners continue to navigate a complex operational landscape shaped by shifting trade policies and labor negotiations:
-
Maritime Fees & Canal Routings: The U.S. suspension of port fees on Chinese-built or operated vessels through January 9, 2027, has eased immediate cost pressures, while improved Panama Canal transit capacity and selective carrier returns to the Suez Canal are altering service rotations. However, Suez transits remain highly contingent on regional security stability.
-
West Coast Labor Negotiations: At the ports of Los Angeles and Long Beach, contract negotiations with International Longshore and Warehouse Union (ILWU) watchmen have been extended through November 20. Terminal operators have cautioned that a potential work stoppage could disrupt facilities responsible for handling more than half of the San Pedro Bay complex’s combined cargo.
The Sobel Network Perspective October’s record-breaking volume underscores how quickly freight demand can rebound even in a year of modest overall growth. With inland transit delays creeping upward and port market shares shifting dynamically between coasts, maintaining flexible routing strategies and proactive customs clearance remains critical.
At Sobel Network Shipping Co., Inc., our team continuously monitors port congestion, carrier routing adjustments, and regulatory shifts to keep your supply chain moving without disruption. If you are planning upcoming Q4 or Q1 shipments and want to evaluate alternative port routings or expedite your customs brokerage, reach out to our logistics specialists today.